crosslink
Commands under this group takes crosslinking data (.bed) in bed format, either from Shoji or htseq-clip or other similar tools and a bed formatted Region Of Interest (ROI) file as inputs, calculate the crosslink profile over the regions and flank and plot them either as line plots or heatmaps.
Crosslink count files, in bed format, can be generated using tools like Shoji or htseq-clip.
csv-meta-example
Print example CSV metadata file for crosslink plotting
Usage
ngs-statter csv-meta-example
A format example and additional descriptions will be printed to the console.
count-crosslinks
Given a region of interest (ROI) file in bed format and a metadata CSV file (see csv-meta-example), this command counts the crosslinks that overlap the regions specified in the ROI file.
Options
option |
description |
required |
default value |
|---|---|---|---|
–metadata |
CSV metadata file specifying crosslinking site files and sample information (see csv-meta-example) |
✓ |
|
–bed |
BED file specifying secondary structure/ primary motif regions of interests (supports .gz files) |
✓ |
|
–out-table |
Output file to write the aggregated table (always .parquet format) |
✓ |
|
–l |
5’ extension length for regions in BED file |
✗ |
100 |
–r |
3’ extension length for regions in BED file |
✗ |
100 |
–unstranded |
If this flag is set, ignore strand information in the BED file and treat all regions as unstranded |
✗ |
|
–most-5prime |
If bed regions overlap, only keep the most 5’ region out of the overlapping regions |
✗ |
|
–norm |
Normalization method: ‘none’ or ‘cpm’[Counts per million] |
✗ |
cpm |
–sw |
When plotting smooth crosslink sites using moving average. Use these many adjacent bases to compute moving average |
✗ |
5 |
–tmpdir |
Temporary directory to use (default: system temp folder) |
✗ |
|
–threads |
Number of threads to use |
✗ |
4 |
Usage
ngs-statter count-crosslinks --metadata path/to/metadata.csv --bed path/to/roi.bed --out-table path/to/output.parquet --l 100 --r 100 --norm cpm
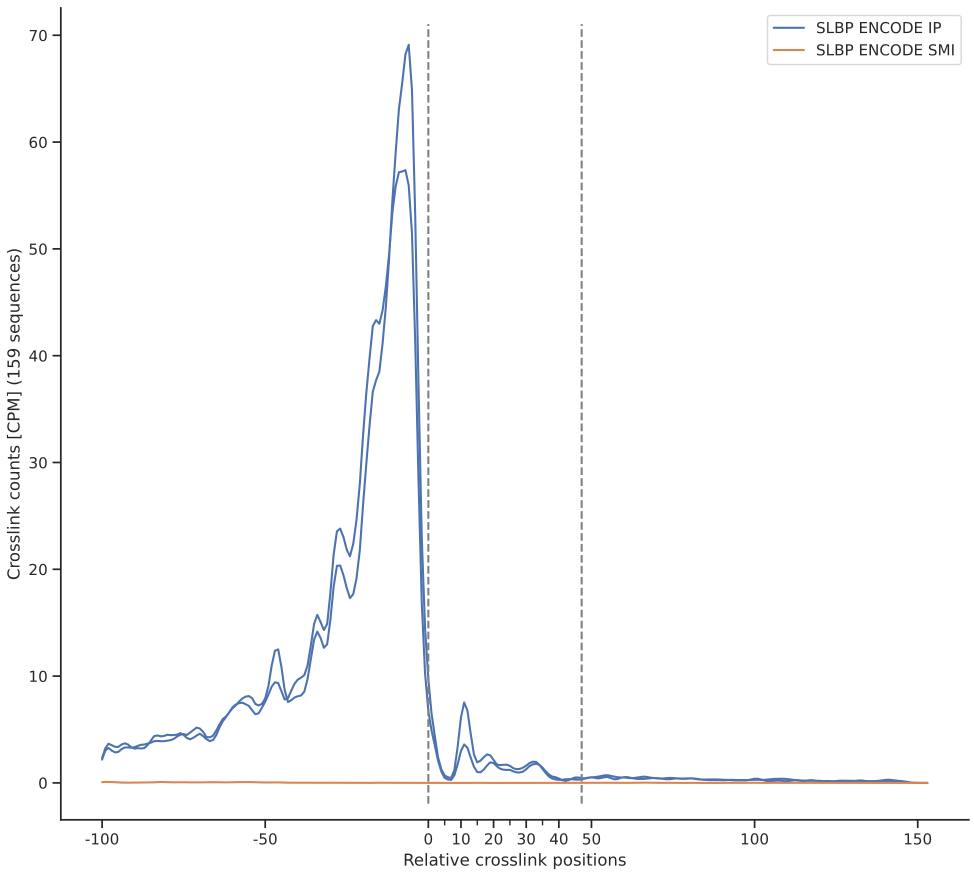
crosslink-line-plot
Given a region of interest (ROI) file in bed format and a metadata CSV file (see csv-meta-example), count the crosslinks that overlap the regions specified in the ROI file, and plot crosslink profiles as line plots.
Options
option |
description |
required |
default value |
|---|---|---|---|
–metadata |
CSV metadata file specifying crosslinking site files and sample information (see csv-meta-example) |
✓ |
|
–bed |
BED file specifying secondary structure/ primary motif regions of interests (supports .gz files) |
✓ |
|
–out-table |
Output file to write the aggregated table (always .parquet format) |
✓ |
|
–l |
5’ extension length for regions in BED file |
✗ |
100 |
–r |
3’ extension length for regions in BED file |
✗ |
100 |
–unstranded |
If this flag is set, ignore strand information in the BED file and treat all regions as unstranded |
✗ |
|
–most-5prime |
If bed regions overlap, only keep the most 5’ region out of the overlapping regions |
✗ |
|
–norm |
Normalization method: ‘none’ or ‘cpm’[Counts per million] |
✗ |
cpm |
–sw |
When plotting smooth crosslink sites using moving average. Use these many adjacent bases to compute moving average |
✗ |
5 |
–out-fig |
Output file to write the plot (svg/pdf/png) |
✓ |
|
–fig-width |
Figure width in centimeters |
✗ |
30 |
–fig-height |
Figure height in centimeters |
✗ |
27 |
–xlabel |
X axis label for the plot |
✗ |
Relative crosslink positions |
–ylabel |
Y axis label for the plot |
✗ |
Crosslink counts |
–title |
Title for the plot |
✗ |
Crosslink profile |
–ymax |
Maximum value for crosslink counts on y axis (determined from data if not set) |
✗ |
|
–show-group-mean |
If this flag is set, show the mean crosslink counts for each group |
✗ |
|
–errorbar |
Error bar to show, see seaborn errorbar tutorial |
✗ |
|
–tmpdir |
Temporary directory to use (default: system temp folder) |
✗ |
|
–threads |
Number of threads to use |
✗ |
4 |
Usage
ngs-statter crosslink-line-plot --metadata path/to/metadata.csv --bed path/to/roi.bed --out-table path/to/output.parquet --out-fig path/to/output.svg --l 100 --r 100 --norm cpm
Example
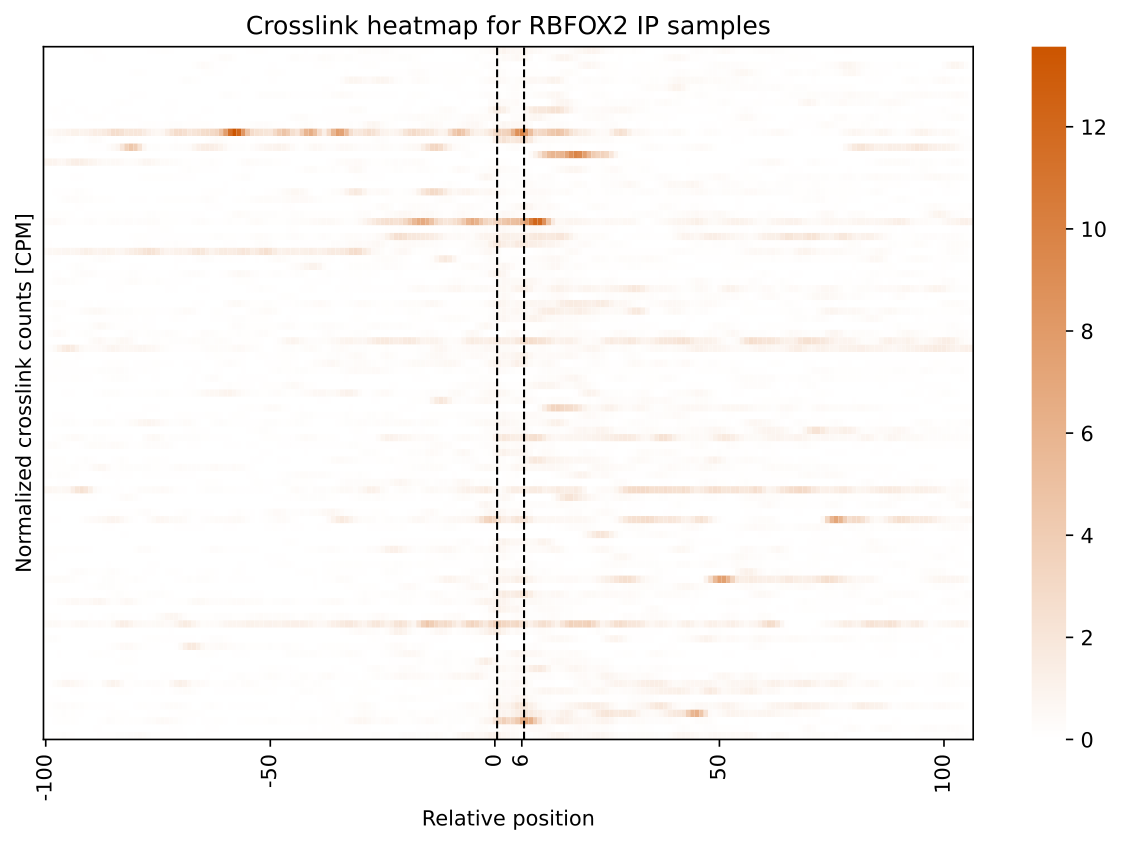
crosslink-heatmap
Given a region of interest (ROI) file in bed format and a metadata CSV file (see csv-meta-example), count the crosslinks that overlap the regions specified in the ROI file, and plot crosslink profiles as heatmaps.
Options
option |
description |
required |
default value |
|---|---|---|---|
–metadata |
CSV metadata file specifying crosslinking site files and sample information (see csv-meta-example) |
✓ |
|
–bed |
BED file specifying secondary structure/ primary motif regions of interests (supports .gz files) |
✓ |
|
–out-table |
Output file to write the aggregated table (always .parquet format) |
✓ |
|
–l |
5’ extension length for regions in BED file |
✗ |
100 |
–r |
3’ extension length for regions in BED file |
✗ |
100 |
–unstranded |
If this flag is set, ignore strand information in the BED file and treat all regions as unstranded |
✗ |
|
–most-5prime |
If bed regions overlap, only keep the most 5’ region out of the overlapping regions |
✗ |
|
–norm |
Normalization method: ‘none’ or ‘cpm’[Counts per million] |
✗ |
cpm |
–sw |
When plotting smooth crosslink sites using moving average. Use these many adjacent bases to compute moving average |
✗ |
5 |
–out-dir |
Output directory for plots. Group specific heatmaps will be written to this directory (svg format) |
✓ |
|
–fig-width |
Figure width in centimeters |
✗ |
30 |
–fig-height |
Figure height in centimeters |
✗ |
27 |
–xlabel |
X axis label for the plot |
✗ |
Relative crosslink positions |
–ylabel |
Y axis label for the plot |
✗ |
Crosslink counts |
–vmin |
Minimum value for crosslink counts on y axis (determined from data if not set) |
✗ |
|
–vmax |
Maximum value for crosslink counts on y axis (determined from data if not set) |
✗ |
|
–tmpdir |
Temporary directory to use (default: system temp folder) |
✗ |
|
–threads |
Number of threads to use |
✗ |
4 |
Usage
ngs-statter crosslink-crosslink-heatmap --metadata path/to/metadata.csv --bed path/to/roi.bed --out-table path/to/output.parquet --out-dir path/to/output_dir --l 100 --r 100 --norm cpm
Example